Using data, analytics, and reporting tools is very useful for
educators to assess individual student performance, progress and needs.
As we look at the data, we can see patterns of behavior to predict
future performance and guide our students towards success. Let’s look
at the artifacts in this quest and examine our hypothetical course.
Enrollments and Attendance:

Once we click on a specific course, part of what you will see is shown above. In the example, we can see that there are two gifted students and four regular ed student. If a student was in the special education program, it would show in the student type column as well. In compliance with FERPA laws, other aspects of this page is not shown. However, in a real course, you would see the student names, gender, expected graduation date, enrollment group, date of enrollment, and the date of completion of the student orientation course. There is an export button on this page that allows the teacher to obtain all this data on a spreadsheet to help organize contact information of students and stakeholders. I also use this spreadsheet to keep track of communication and enrollment switches throughout the semester.

The communication log above shows the type, person, nature of the call, date and any comments written by the teacher. Communication is a very important aspect of online learning and documenting this is vital in keeping administrators informed about each student. When a problem arises, they can read the communication log to get a general idea of a student’s situation and address it appropriately.
Monitoring Course Progress with Observational Data & Analytics:

The heat map above shows student grades on the left column and the colored squares shows student activity within the course. This image gives the teacher a quick assessment of which students are making progress or not. Teachers can use this information to explain why a student is struggling and suggest ways to improve performance when contacting stakeholders.
Feedback:
Feedback is an important element provided to students so they can improve their performance. Below is an example of what a student would see when they click on their gradebook. The assignment name is first, the raw score, grade percentage, then the feedback given by the teacher.

Here is a what a student would see when reviewing a test or quiz that has been graded. In the math courses, there is feedback for each question so they can see the solutions to the problems they missed.

When looking at the dropbox assignments, they will see their grade the number of submissions.

Clicking on the paper icon will show them specific feedback given by the teacher.

*This post is the collaboration work between Alice Johnson, Heather McCormick and Cameron Wood.
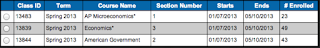
Enrollments and Attendance:
This image shows the three courses that are assigned to this teacher.
We can see the number of students enrolled in each course and the
start and end date of the semester. When courses are assigned, the
first course to be filled is ‘section 1,’ second to be filled is
‘section 2’, third to be filled is “‘section 3’, etc.

Once we click on a specific course, part of what you will see is shown above. In the example, we can see that there are two gifted students and four regular ed student. If a student was in the special education program, it would show in the student type column as well. In compliance with FERPA laws, other aspects of this page is not shown. However, in a real course, you would see the student names, gender, expected graduation date, enrollment group, date of enrollment, and the date of completion of the student orientation course. There is an export button on this page that allows the teacher to obtain all this data on a spreadsheet to help organize contact information of students and stakeholders. I also use this spreadsheet to keep track of communication and enrollment switches throughout the semester.

The communication log above shows the type, person, nature of the call, date and any comments written by the teacher. Communication is a very important aspect of online learning and documenting this is vital in keeping administrators informed about each student. When a problem arises, they can read the communication log to get a general idea of a student’s situation and address it appropriately.
Monitoring Course Progress with Observational Data & Analytics:

The heat map above shows student grades on the left column and the colored squares shows student activity within the course. This image gives the teacher a quick assessment of which students are making progress or not. Teachers can use this information to explain why a student is struggling and suggest ways to improve performance when contacting stakeholders.
Feedback:
Feedback is an important element provided to students so they can improve their performance. Below is an example of what a student would see when they click on their gradebook. The assignment name is first, the raw score, grade percentage, then the feedback given by the teacher.

Here is a what a student would see when reviewing a test or quiz that has been graded. In the math courses, there is feedback for each question so they can see the solutions to the problems they missed.

When looking at the dropbox assignments, they will see their grade the number of submissions.
Clicking on the paper icon will show them specific feedback given by the teacher.

*This post is the collaboration work between Alice Johnson, Heather McCormick and Cameron Wood.
No comments:
Post a Comment